Using this example coming from Wikipedia, in which DrawSquare() calls DrawLine():
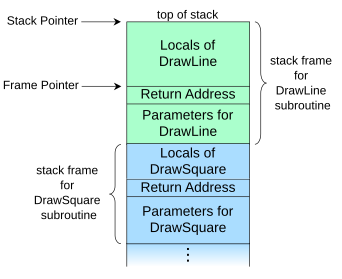
(Note that this diagram has high addresses at the bottom and low addresses at the top.)
Could anyone explain to me what ebp and esp are in this context?
From what I see, I'd say the stack pointer points always to the top of the stack, and the base pointer to the beginning of the current function? Right?
edit: I mean this in the context of Windows programs.
edit2: And how does eip work, too?
edit3: I have the following code from MSVC++:
var_C= dword ptr -0Ch
var_8= dword ptr -8
var_4= dword ptr -4
hInstance= dword ptr  8
hPrevInstance= dword ptr  0Ch
lpCmdLine= dword ptr  10h
nShowCmd= dword ptr  14h
All of them seem to be dwords, thus taking 4 bytes each. So I can see there is a gap from hInstance to var_4 of 4 bytes. What are they? I assume it is the return address, as can be seen in the diagram from Wikipedia.
(editor's note: removed a long quote from Michael's answer, which doesn't belong in the question, but a followup question was edited in):
This is because the flow of the function call is:
- Push parameters (hInstance, etc.)
- Call function, which pushes return address
- Push ebp
- Allocate space for locals
My question (last one, I hope!) now is, what exactly happens from the instant I pop the arguments of the function I want to call up to the end of the prolog? I want to know how the ebp, esp evolve during those moments (I already understood how the prolog works, I just want to know what is happening after I pushed the arguments on the stack and before the prolog).

Best Answer
espis as you say it is, the top of the stack.ebpis usually set toespat the start of the function. Function parameters and local variables are accessed by adding and subtracting, respectively, a constant offset fromebp. All x86 calling conventions defineebpas being preserved across function calls.ebpitself actually points to the previous frame's base pointer, which enables stack walking in a debugger and viewing other frame's local variables to work.Most function prologs look something like:
Then later in the function you may have code like (presuming both local variables are 4 bytes)
FPO or frame pointer omission optimization which you can enable will actually eliminate this and use
ebpas another register and access locals directly off ofesp, but this makes debugging a bit more difficult since the debugger can no longer directly access the stack frames of earlier function calls.EDIT:
For your updated question, the missing two entries in the stack are:
This is because the flow of the function call is:
hInstance,PrevInstance,hlpCmdLine,nShowCmd)ebp